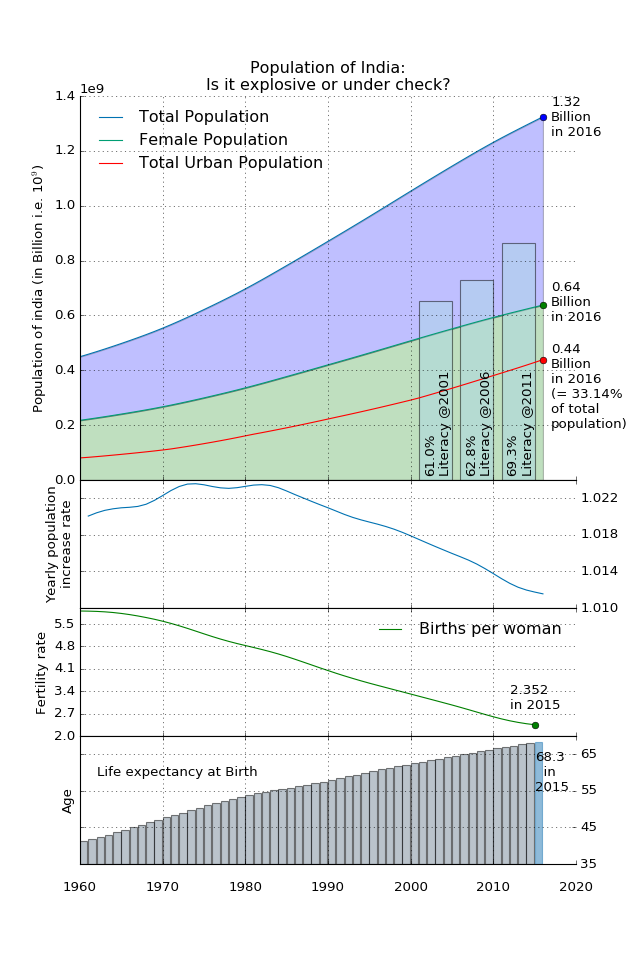
We all know that India has the second largest population and we are close to China’s population. It is also know that India’s population is getting closer to China’s population. So the question I had was, is India’s population on an explosive path or is it under check with right measures in place?
To tackle China’s growth, China enforced 1 child policy. India doesn’t have such a policy. With the data from World Bank I tried to explore India’s population trend and find answers to my question.

There is no doubt that the population of India is exhibiting an increasing trend; However, the rate of increase is on a decreasing trend for quite sometime.
Some additional facts discovered during the analysis:
- India has more men than women.
- As of 2016, 33.14% of Indians lives in urban areas
- India has seen a surge in literacy between 2006 and 2011, where the literacy count moved up by 6.5% (from 62.8% to 69.3%). As per wiki India’s literacy rate in 2017 is 70.04 %.
- Increasing literacy rate also means that people from rural areas are also getting educated. 66.86% Indians are from rural areas.
- The ratio: Nth year’s population / (N-1)th year’s population, is showing a decreasing trend.
- Fertility rate or births per woman in India is also on a decreasing trend, in 1960 it was 5.906 and in 2015 it was 2.352. If India reaches Fertility rate of 2.00 in future it will hold the population at a constant level. Based on the trend Fertility rate of 2.0 will happen in near future.
- Additionally, life expectancy at birth is on an increasing trend. It means medical facilities are more readily available than past. With increasing life expectancy the real decreasing trend in rate of population increase must be sharper than identified.
Above observation confirms that India’s population is not on an explosive track. Ruther, the measures taken by Indians are working. India is heading toward a halt in population increase, it will be reached when Fertility rate will be 2.
I generated this graph by using Python. The data set I worked with to generate this graph is from World Bank and is an extract of their data on World development indicators.
Source: http://databank.worldbank.org/data/reports.aspx?source=world-development-indicators
